

John Stigerwalt released a post on LinkedIn which highlighted the use of assembly to retrieve Windows functions via the PEB. This naturally interested me, led to me messing with assembly and eventually lead to me writing this blog. You can find his post here. Talking about some of his research and shared content seemed like a good place to start my blog series.
Part 1 of this series will discuss a common malware development problem that affects the bypassing both Static Detections and Dynamic Detections when working with Windows Portable Executable (PE) files. The accessing of sensitive Windows Native API functions.
I am by no means an expert in any of the below areas, and I shall describe things as per my understanding of them. Furthermore, this blog is aimed at current offensive professionals and/or curious developers. I do not condone nor encourage my materials or shared knowledge to be used for any form of illegal or unethical activity. This blog is aimed at spreading knowledge about malware development techniques to security professionals and other curious minds.
You can find all the code I use within this blog here
My research and learning could not be done without the knowledge shared from the following individuals and the materials they have produced. My content largely references their work, and I look up to these individuals.
Function resolving can be problematic for malware developers. This can be split into a set of smaller problems.
Problem #1 - Pre-execution: Static Analysis and Sandbox Environments
Amongst malware developers there is a common desire to reduce the entries in a PE’s Import Address Table (IAT). The IAT provides defenders and defensive tooling an idea of what native functions a PE is calling and therefore it allows for deductions on what the PE might be doing before it is even executed. Consequently, keeping the IAT entries minimal or rather keeping suspicious Windows Native API imports out of IAT is highly desirable for malware developers.
Furthermore, often if a particular defensive security tool is uncertain of a PE following a static analysis pass, a PE may be subject to a minimal form of Dynamic Analysis in a virtual environment such as a Sandbox. This is could be an attempt to confirm any suspicions raised during the Static Analysis scan. Really this is a form of Dynamic Analysis but I thought it would be more appropriate here as I consider it part of the pre-execution phase and directly dependant on Static Analysis. Local sandboxed execution is suspected to also only be performed for a very short time to avoid decreased user experiences and but in-depth to Dynamic Analysis could be performed thereafter in the security vendor’s cloud container.
Problem #2 - Post Execution: Dynamic Analysis
If it is possible to get to the stage of PE execution, after its successfully passed any Static Analysis scrutiny and/or temporary Sandbox Environments, the main problem will be facing something like an EDR.
Many EDR products exist and they all function in different ways, it is my opinion that they perform some of the following:
ntdll.dll. Or perhaps leveraging the Microsoft Threat Intelligence Event Tracing for Windows (ETW-TI)If we were to consider function hooking specifically, directly accessing and calling specific Windows Native API functions is known to trigger an EDR. Therefore, resolving access to Windows Native API functions during the PE’s runtime is seen as desirable for malware developers.
Existing Solutions
To address both these problems malware developers have leverage usage of two common kernel32.dll functions - GetProcAddress and GetModuleHandle. Or have perhaps opted to use direct or indirect syscalls (which comes with its own set of challenges) and depending on the code implementations may still result in a PE file having multiple suspicious imports in IAT. Having the ability to stealthily resolve functions on a given Windows system (whether for usage, hook inspection, or to setup an direct/indirect syscalls) is highly beneficial to a threat actor.
Lets review GetProcAddress and GetModuleHandle:
These can be called directly which would result in entries for at least both these functions in IAT (an probably an EDR detection if you ever made it to the execution phase). Or more commonly, malware developers have implemented their own custom versions of these functions in their preferred programming language.
Having used C++ or C# custom implementations of these functions, I noticed that the usage of imported Windows functions accumulated and made for a lengthy IAT entries table. When implementing your own versions of GetProcAddress and GetModuleHandle in C++ or C# to resolve other kernel32.dll or ntdll.dll functions, you cannot really reduce the existing IAT entries as you are trying to achieve the very functionality you need, which is a bit of a chicken and egg problem. While some existing IAT entries may not be “suspicious” as such, I want to explore opportunities that result in a “leaner” PE IAT entries table.
So lets explore some ideas to try and achieve stealthy Native API Windows function resolves, so that we may inspect them, modify them, or use them to setup a direct/indirect syscall.
But first, to warmup the reader’s brain let’s go through some x64 MASM assembly revolving around working with strings, prior going through the resolving module base addresses and function addresses.
Note: Sandbox evasion techniques and setting up direct/indirect syscalls wont be part of this initial blog, but may be covered in subsequent blogs released for the series.
I have moved this section to Knowledge Primer as it will be added too over the blog series. Furthermore, all code discussed for this section is in my final GitLab project (See link above).
Note: If you are not familiar with low-level programming concepts such as assembly, I strongly recommend you read the Knowledge Primer to get the most out of my content - it will be updated with references over the course of the blog series.
If you plan not to read the above section. We discuss some x64 MASM assembly function implementations, to be used in later code:
1
2
3
4
get_string_length() - string length till NULL byte
compare_strings() - byte by byte comparison for strings with common length
Obf() - simple string obfuscation function
DeObf() - simple string de-obfuscation function
Obfuscated strings to be used in C++ code later on:
1
2
Obfuscated: 'ntdll.dll' is 'osekm-ekm'
Obfuscated: 'NtDelayExecution' is 'OsEdm`zDyddtuhpm'
Resolving Windows functions requires that we have a DLL base address from which we want to search for functions. So lets start by retrieving a given process loaded DLL base address with assembly.
Lets cover the main steps of resolving a given Windows DLL base address with assembly:
PEB->LdrPEB->Ldr->InLoadOrderModuleList (double-linked list)Let us try an resolve NTDLL.DLL from the current process.
In x64 Windows systems, the GS register points directly to the Thread Environment Block (TEB) for the current thread, which contains a pointer to the Process Environment Block (PEB). The PEB contains various information about a process, such as process parameters, environment variables, and loaded modules. In x86 Windows systems the same is true for the FS segment register.
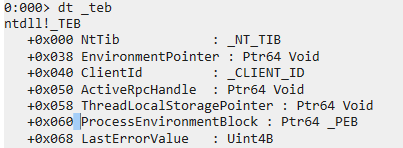
From the above screenshot, if we were to inspect the TEB structure in Windbg we can see that the PEB is at offset 0x60. Therefore, since the GS segment register already points to the current process’s TEB we can simply point to offset 0x60 in the GS register to access the value at that location - in this case the address of PEB.
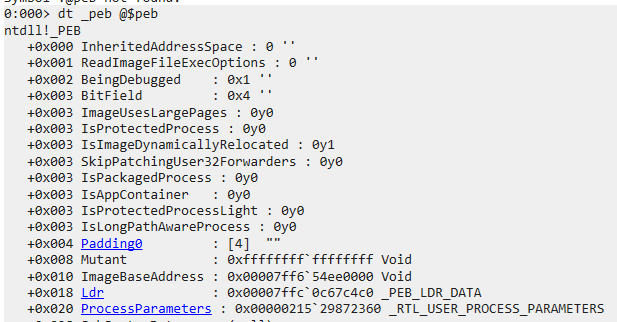
Looking at the PEB structure we can see that the offset to Ldr is at 0x18. In the Process Environment Block (PEB), Ldr points to a PEB_LDR_DATA structure. This structure is used to manage loaded modules (such as DLLs) in the current process. It includes information about loaded modules, most importantly, their base addresses and name.
The PEB_LDR_DATA structure looks like this:
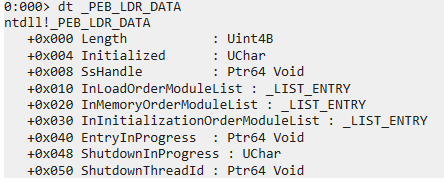
We are most interested in InLoadOrderModuleList which a pointer? to a double linked list. The linked list allows us to navigate between the LDR_DATA_TABLE_ENTRY structures that contain loaded module information.
The LDR_DATA_TABLE_ENTRY structure looks like so:
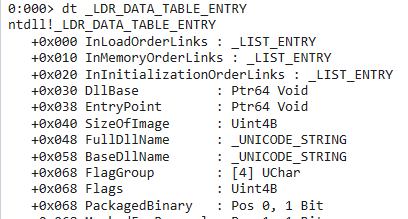
Within LDR_DATA_TABLE_ENTRY we can see the dllBase at offset 0x30 and the baseDllname (DLL name) at offset 0x58.
Note as we are traversing the loaded module linked list, our “default” position/offset in each accessed linked list LDR_DATA_TABLE_ENTRY will be at 0x10 (InMemoryOrderLinks).
Now that the basics of what we are trying to achieve are covered, we can can implement assembly code.
Example x64 MASM assembly to resolve the NTDLL.DLL base address can be represented as such:
1
2
3
4
5
6
7
8
9
10
11
12
13
14
15
16
17
18
19
20
GetNtdllBase proc
    ; Load the address of PEB into RAX via GS segment
    xor rax, rax
    mov rax, gs:[60h]

    ; Navigating PEB->Ldr->InLoadOrderModuleList
    mov rax, [rax + 18h]         ; Offset of PEB->Ldr in PE
    mov rax, [rax + 20h]         ; Offset of Ldr->InLoadOrderModuleList
	; Ldr->InLoadOrderModuleList points to the first LDR_DATA_TABLE_ENTRY structure in the linked list

	; We are currently at linked list node 0 (PE itself) so we can derefence once to get to node 1 (ntdll.dll)
	mov rax, [rax]
	; Since we are in LDR_DATA_TABLE_ENTRY and already at offset 0x10 (InMemoryOrderLinks)
	; We add 0x20 to access the dllBase address (offset 0x30) value by derefencing
	mov rax, [rax + 20h]

	; We now have NTDLL.DLL base address in rax which we can return
	; or use for further assembly operations
	ret
GetNtdllBase endp
We can test the above GetNtdllBase assembly function with some C++ code in a MASM enabled VS project:
1
2
3
4
5
6
7
8
9
10
11
12
13
14
15
16
17
18
19
#include <Windows.h>
#include <stdio.h>

// Assembly function declarations
extern "C" DWORD_PTR GetNtdllBase();

int main() {
    // resolve ntdll.dll base address
    DWORD_PTR TargetAddr=0;
    TargetAddr = (DWORD_PTR)GetNtdllBase();
    if (TargetAddr) {
        printf(" ntdll.dll base address (Assembly DLL resolve via PEB): 0x%p \n", TargetAddr);
    } else {
        printf("Failed to get %s base address \n", dllName);
        return 1;
    }
    getchar(); // effectively pause EXE by getting user input
    return 0;
}
Execution:
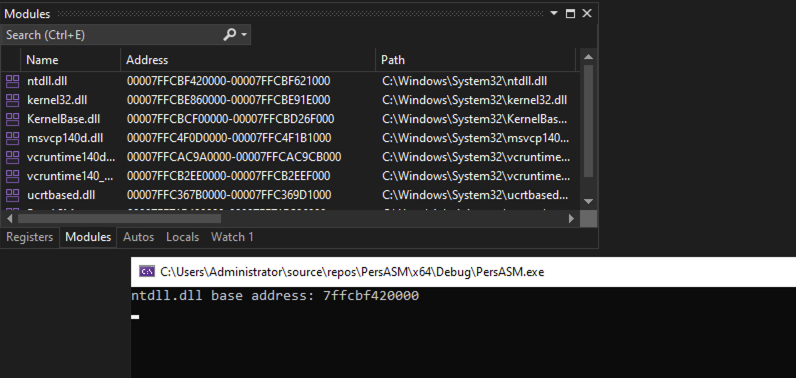
Now that the basics of getting access to process loaded DLL bases addresses are covered, we can build on the assembly so that it allows us to resolve the base address of ANY process loaded DLL. The easiest way to do that, would be to search LDR_DATA_TABLE_ENTRY entries the InLoadOrderModuleList linked list for DllBaseName (offset 0x58) values that match the DLL name we wish to resolve.
You can get a rough idea of the DllBaseName structure here:

Once you access the DllBaseName struct you will find its Length at offset 0x00 and its content buffer at 0x8. Keep in mind that the buffer points to the base address of a character array, each character being separated by a null byte.
Custom x64 assembly implementation of GetProcAddress:
Note:
compare_module_stringsfunction can be found in my Github source code.
My code is based on the following sources: Source1 Source2
1
2
3
4
5
6
7
8
9
10
11
12
13
14
15
16
17
18
19
20
21
22
23
24
25
26
27
28
29
30
31
32
33
34
35
36
37
38
39
40
41
42
43
44
45
46
47
48
49
50
51
52
53
54
55
56
57
58
59
60
61
62
63
64
65
66
67
68
69
70
71
72
73
74
75
76
77
78
79
80
81
82
83
84
85
86
87
88
89
90
GetBase proc

    ; Input parameters:
    ;   rcx: Pointer to target dllName string
    ;   rdx: Length of the target dllName string
    ; Output:
    ;   rax: Length of the string

    ; Important variables
    mov r12, rcx ; r12 contains ptr to target dllName str
    mov r13, rdx ; r13 contains value of target dllName length

    ; clear these registers
    xor rcx, rcx
    xor rdx, rdx

     ; Load the address of PEB into RAX via GS segment
    xor rax, rax
    mov rax, gs:[60h]

    ; Navigating PEB->Ldr->InLoadOrderModuleList
    mov rax, [rax + 18h]         ; Offset of PEB->Ldr in PE
    mov rax, [rax + 20h]         ; Offset of Ldr->InLoadOrderModuleList

    ; Loop through InLoadOrderModuleList double-linked list module entries

module_loop:
    ; Check if current pointer of rax is null
	; If null, end of linkedlist has been reached and module has not been found
    cmp qword ptr [rax], 0
    je base_error

	; Get the entry in the InLoadOrderModuleList (ntdll.dll)
    mov rax, [rax]
    ; Current offset is 0x10 already
	; As we are in the linked list element of the LDR_DATA_TABLE_ENTRY struct

	; baseDLLName should be at 0x58-0x10 (offset 0x48)
	; DllBaseName struct has Length at 0x00
    ; Length of the module name struct at [rax + 48h]
    ; Divide length by 2 to account for null byte seperators
    xor rdx, rdx
    mov dx, word ptr [rax + 48h] ; length of module name
    ; length of string with every char suceeded by a NULL byte so twice the length of number of characters
    ; we need to divide the length by 2, to get the number of characters
    shr rdx, 1

	; Compare current module baseDLLName with target dllName length
    cmp rdx, r13
    ; if length not equal move to next item
    jnz module_loop
    ; if equal move to byte-by-byte comparison of the two strings

	; Compare each byte in current module DllBaseName string with our target dllName string
    ; If strings match, find the base address of current module

    ; rbx contains module string length
    mov rcx, [rax + 48h + 8h] ; access current module string pointer as arg1
    mov rdx, r12 ; target module name as arg2
    mov r8, r13  ; length as arg3

    ;save rax for later if needed
    push rax

    ; need a string comparisson function that handles the char offsets of module name (every other byte)
    ; rcx - module name ptr
    ; rdx - target module name
    ; r8 - common real length

    call compare_module_strings ; compare strings that handles the null bytes

    ; check if rax is 0; if not strings not equal
    cmp rax, 0
    ; restore registers
    pop rax
    jnz module_loop ; if no match continue looping

    ; rax contains ptr to current module struct LDR_DATA_TABLE_ENTRY
	; get the offset of the current module baseAddress at 0x30
	; Since we are already at offset 0x10 in LDR_DATA_TABLE_ENTRY
	; Offset to base address is (0x30-0x10) so 0x20
    mov rax, [rax + 20h]
    ret

base_error:
	; return 0 if error
    mov rax, 0
    ret

GetBase endp
To use our custom GetBase (GetProcAddress) x64 MASM assembly function we can use C++ code once more. We can simply amend our previous C++ code example to allow for the execution of our GetBase() assembly function:
1
2
3
4
5
6
7
8
9
10
11
12
13
14
15
16
17
18
19
20
21
22
23
24
25
26
27
28
29
30
31
32
#include <Windows.h>
#include <stdio.h>

// Assembly function declarations
extern "C" DWORD_PTR GetBase(LPCSTR dllName, SIZE_T length);
extern "C" int get_string_length(char* i);// works
extern "C" void* Obf(char* i, size_t l);
extern "C" void* DeObf(char* i, size_t l);
extern "C" int main();

int main() {

	// SEARCH STRINGS
    //
    char dllNameObf[] = "osekm-ekm"; // ntdll.dll
    char* dllName = { 0 }; // ASM WILL HANDLE UPPERCASE AND LOWERCASE
    dllName = (char*)DeObf(dllNameObf, get_string_length(dllNameObf));

    // Functional x64 MASM assembly custom GetProcAddress
    // Resolves base address of any process loaded DLL
    // PARAMS: DllName, DllName length
    size_t nameLen = strlen(dllName);
    DWORD_PTR baseAddress = GetBase(dllName, nameLen); // store retrieved address
    if (baseAddress == 0) {
        printf("Failed to get %s base address \n", dllName);
        return 1;
    }
    printf(" %s base address (Assembly DLL resolve via PEB): 0x%p \n", dllName, baseAddress);

    getchar(); // effectively pause EXE by getting user input
    return 0;
}
Sticking with above example, we will also focus this section on ntdll.dll and resolving an arbitrary function address - in this case we will use NtDelayExecution.
At a high level - in order to resolve a function address from a process loaded DLL, the most important requirements are a base address to the DLL we wish to access and the name of the function we want to resolve. To be consistent with the section above, we shall use NTDLL.DLL as the DLL and NtDelayExecution as the function we wish to resolve.
The overall function resolving process will look like so:
DOS->e_lfanew + module base addressDataDirectory (total offset 0x88)AddressOfNames offset (0x20)AddressOfOrdinalNames offset (0x24)AddressOfFunctions offset (0x1C)AddressOfNames entries
AddressOfNames array index on matchAddressOfNames array index in the AddressOfNameOrdinals array
AddressOfNameOrdinals array indexAddressOfFunctions array at using the ordinal as the index
PE Header struct overview (We can see that DataDirectory is at offset 0x88 - OptionalHeader offset + DataDirectory offset):
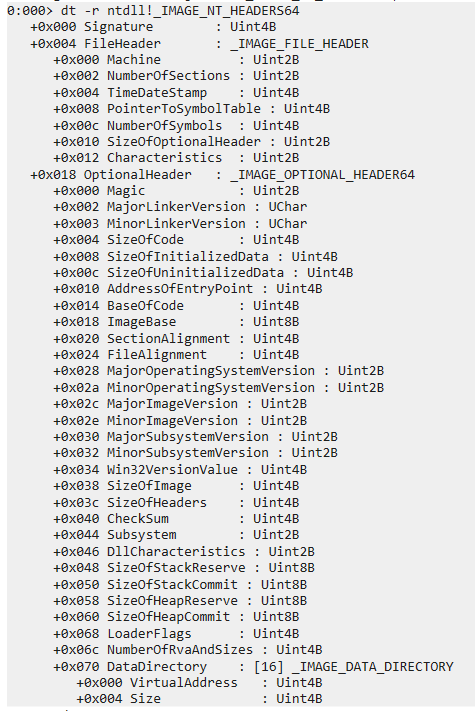
To achieve our goals we will need to through the PE header of the module we are processing. We need to pinpoint 3 key resources nested within that will allow us to perform our function lookup:
AddressOfNames - Names TableAddressOfOrdinalNames - Ordinal Names TableAddressOfFunctions - Function Address TableThese are all contained in the IMAGE_EXPORT_DIRECTORY struct that can visualised below. More on these in a minute.
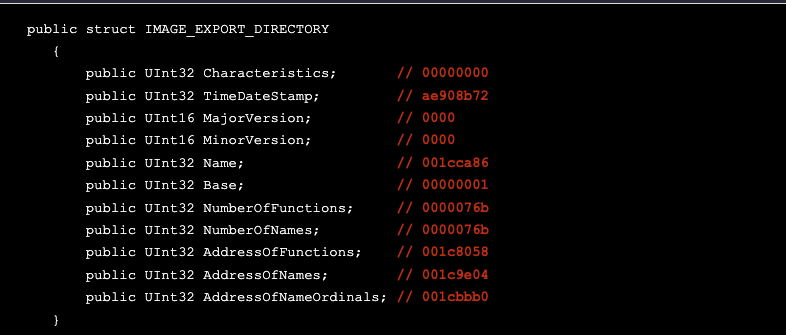
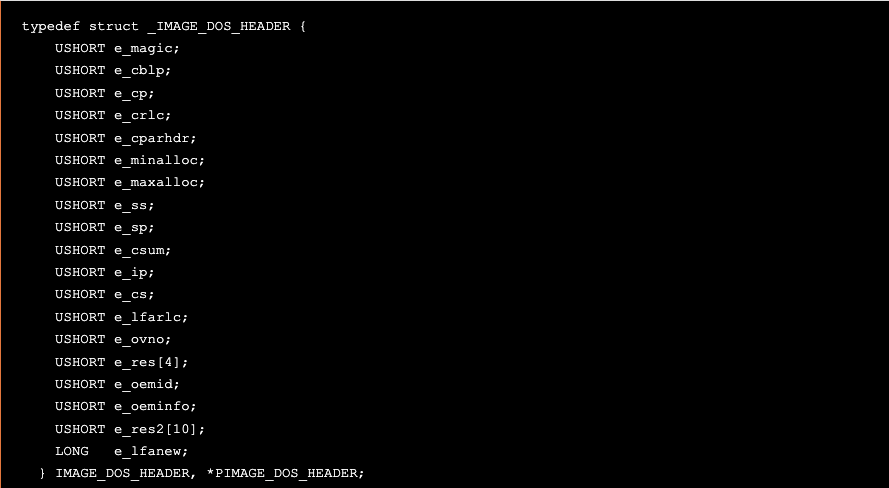
In order to access the IMAGE_EXPORT_DIRECTORY struct we need to add the value pointed by ofDOS->e_lfanew to the module base address. DOS->e_lfanew is the offset to the PE Header and is defined within the IMAGE_DOS_HEADER struct.
Here is an explanation to the inter dependance of the AddressOfNames, AddressOfOrdinalNames and AddressOfFunctions tables and how one should navigate them to resolve a desired function address.
AddressOfNames array from i=0 to i=(NumberOfNames-1), comparing AddressOfNames[i] with the string name3.i position, the loader will refer to AddressOfNameOrdinals[i] and get the ordinal associated to this function. Let’s suppose that AddressOfNameOrdinals[i] = 4.ordinal = 4, the loader will now refer to AddressOfFunctions on 4th position, that is AddressOfFunctions[4], to finally get the RVA associated to the name3 function.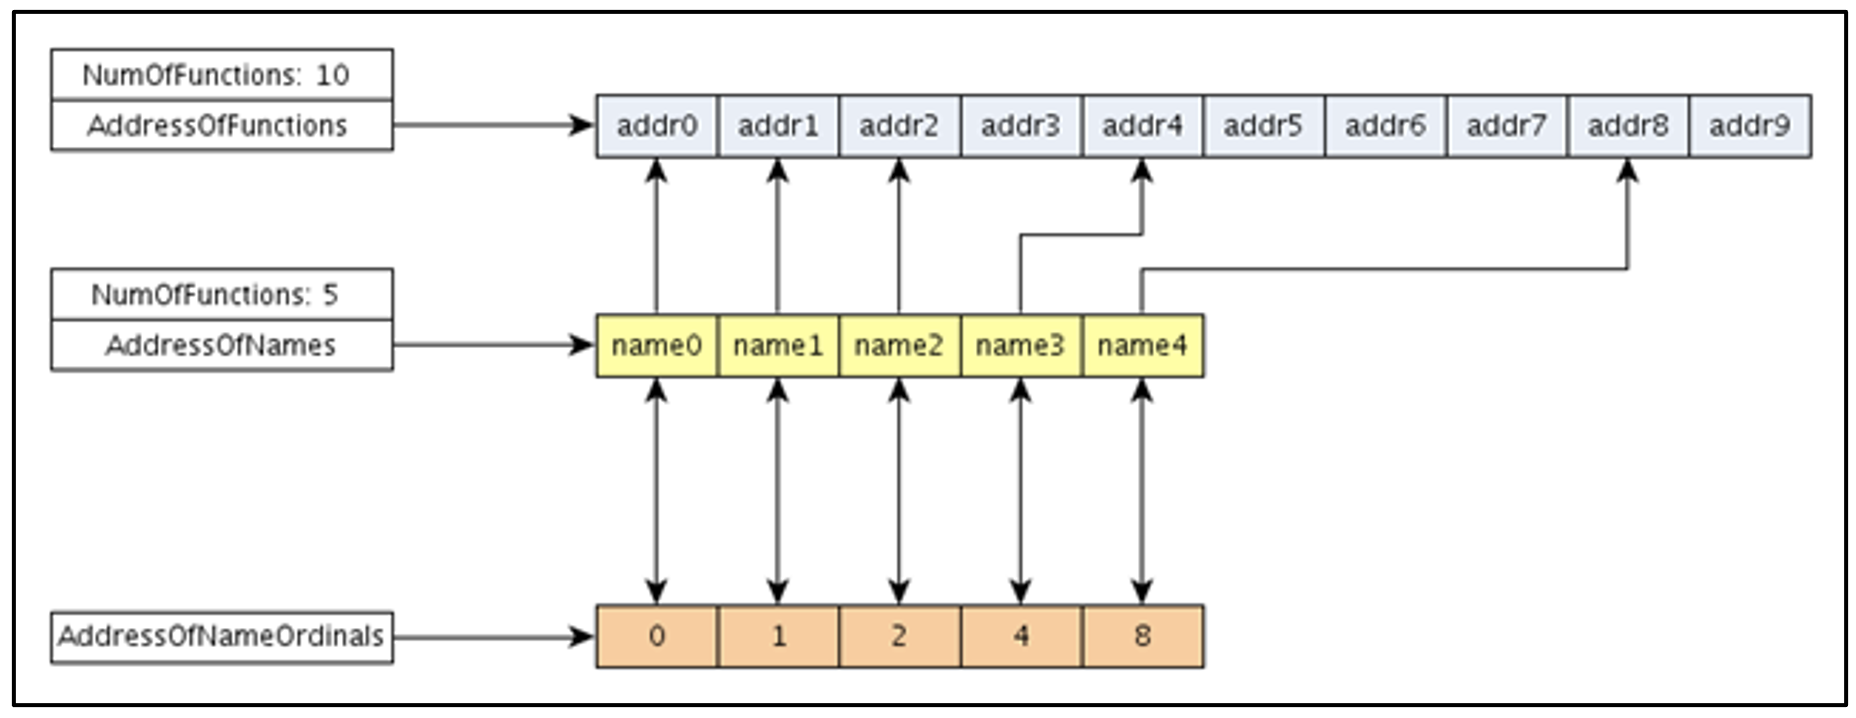
Now that we have covered the theory, given the amount of considerations to achieving the function resolve its time to dive into the assembly. The comments should hopefully break down the process into understandable chunks.
Custom x64 assembly implementation of GetModuleHandle:
Note: Assembly string comparison functions omitted for brevity, can be found in my code repo.
My code is based on the following sources: Source1 Source2
1
2
3
4
5
6
7
8
9
10
11
12
13
14
15
16
17
18
19
20
21
22
23
24
25
26
27
28
29
30
31
32
33
34
35
36
37
38
39
40
41
42
43
44
45
46
47
48
49
50
51
52
53
54
55
56
57
58
59
60
61
62
63
64
65
66
67
68
69
70
71
72
73
74
75
76
77
78
79
80
81
82
83
84
85
86
87
88
89
90
91
92
93
94
95
96
97
98
99
100
101
102
103
104
105
106
107
108
109
110
111
112
113
114
115
116
117
118
119
120
121
122
123
124
125
126
127
128
129
130
131
132
133
134
135
136
137
138
139
140
141
142
143
ResolveFunction PROC

        ; Input parameters:
        ;   rcx: Pointer to functionName string
        ;   rdx: Length of the string
        ;   r8:  Base address of module
        ; Output:
        ;   rax: Length of the string

        ; set functionName rcx (arg1) to r9 as pointer
        mov r9, rcx

       	; set length of string rdx (arg2) to r13 (value?)
        mov r13, rdx

        ; pass r8 (arg3) which has module base address into r11
        mov r11, r8

        ; pass DLL PE HEADER to resolve export table for function symbol search
        xor r8, r8                        ; Clear R8
        mov r8d, dword ptr [r11 + 3Ch]
        mov rdx, r8                		  ; Move DOS->e_lfanew to RDX
        add rdx, r11                      ; Calculate PE Header address + base address
        ; rdx should now point to PE header
        mov r8d, dword ptr [rdx + 88h]    ; Calculate offset to the export table (OptionalHeader (0x18) + DataDirectory (0x70) offsets)
        add r8, r11                       ; Update R8 to point to the export table
        ; r8 should now point to Export Table
        sub rsi, rsi                      ; Clear RSI
        mov esi, dword ptr [r8 + 20h]     ; Calculate the offset to the names table with split offsets
        add rsi, r11                      ; Update RSI to point to the names table
        ; rsi should now point to Names Table
        mov r12, 0                        ; Initialize RCX to 0

        ; registers we need currently in this func:
        ; r9  ; funcName
        ; r13 ; funcName length
        ; r11 ; ntdll base
        ; rdx ; ntdll PE header address
        ; r8  ; ntdll Export table address
        ; rsi ; ntdll Names table address
        ; r12 ; as iterations counter

        ; rax will be used to point to ntdll funcs as we iterate
        ; this leaves the following registers free for other operations = rcx, rbx, rdi, r14, r15, r10

        ; loop the different process loaded DLL symbol/function names
    Get_Function:
        inc r12                       ; Increment the ordinal
        mov rax, 0                    ; Clear RAX
        mov eax, [rsi + r12 * 4]      ; Load the next function name offset
        add rax, r11                  ; Calculate the actual function name address

        ; Extra check for currentFunc length matching the FuncName length

        ; save all important registers and restore after str length comparisons
        push r9
        push r13
        push r11
        push rdx
        push r8
        push rsi
        push r12
        push rax

        ; compare string length
        ; resolve length of current func str
        mov rcx, rax    ; move current func ptr to rcx

        call get_string_length ; this will return current func length in rax
        ; rax is now currentFunc length and rcx is ptr to current func
        cmp rax, r13    ; compare str length between current func (rax) and funcName (r13)
        ; if not equal go to next iteration - no need to restore rax

        ; restore all registers
        pop rax
        pop r12
        pop rsi
        pop r8
        pop rdx
        pop r11
        pop r13
        pop r9

        jnz Get_Function
        ; if equal, restore rax and continue comparison

        ; Perform a byte comparison between 2 strings of the same length
        ; save all important registers again and restore after str comparisons
        push r9
        push r13
        push r11
        push rdx
        push r8
        push rsi
        push r12
        push rax

        ; prep for func call here
        ; rax has our currentFunc ptr
        ; r9 is FuncName (by value if we want ptr comment out line 40)
        ; r13 is length of funcName - but same as currentFunc since there was a match earlier for length
        mov rcx, rax ; ptr to currentFunc
        mov rdx, r9  ; ptr to FuncName
        mov r8, r13  ; common length of strings

        ; call
        call compare_strings ; will return 0 for true ; if not zero compare_strings will restore (r8, rdx, rcx) and loop again (Get_Function)

        ; check if rax is 0; if not strings not equal
        cmp rax, 0
        ; restore registers
        pop rax
        pop r12
        pop rsi
        pop r8
        pop rdx
        pop r11
        pop r13
        pop r9
        jnz Get_Function ; this is triggered if string compare failed - should be safe to restore registers before as long as we dont modify conditional flags

        ; if here rax is 0 and strings are the same
        ; means rax after restore is the correct currentFunc address
        ; we can now resolve the address properly?

        ; once symbol names match between currentFunc and funcName we can resolve the func address
        sub rsi, rsi                  ; Clear RSI
        mov esi, [r8 + 20h + 4h]      ; Calculate offset to the ordinals table with split offsets
        add rsi, r11                  ; Update RSI to point to the ordinals table
        mov r12w, [rsi + r12 * 2]     ; Load ordinal number
        sub rsi, rsi                  ; Clear RSI again
        mov esi, [r8 + 0eh + 0eh]     ; Calculate offset to the address table with split offsets
        add rsi, r11                  ; Update RSI to point to the address table
        mov rdx, 0                    ; Clear RDX
        mov edx, [rsi + r12 * 4]      ; Load the function address (offset)
        add rdx, r11                  ; Calculate the actual function address

        ; Save function address for later use
        ; Save the actual address of the target function in getFunctionAddr
        mov rax, rdx
        ret

ResolveFunction ENDP
We can test the above code by building upon our previous C++ code example:
1
2
3
4
5
6
7
8
9
10
11
12
13
14
15
16
17
18
19
20
21
22
23
24
25
26
27
28
29
30
31
32
33
34
35
36
37
38
39
40
41
42
43
44
45
46
47
#include <Windows.h>
#include <stdio.h>

// Assembly function declarations
extern "C" DWORD_PTR GetBase(LPCSTR dllName, SIZE_T length);
extern "C" DWORD_PTR resolveFunction(LPCSTR functionName, SIZE_T length, DWORD_PTR moduleBase);
extern "C" int get_string_length(char* i);// works
extern "C" void* Obf(char* i, size_t l);
extern "C" void* DeObf(char* i, size_t l);
extern "C" int main();

int main() {

    // SEARCH STRINGS
    //
    char dllNameObf[] = "osekm-ekm"; // ntdll.dll
    char functionNameObf[] = "OsEdm`zDyddtuhpm"; // NtDelayExecution
    char* dllName = { 0 }; // ASM WILL HANDLE UPPERCASE AND LOWERCASE
    char* functionName = {0}; // this is case sensitive
    dllName = (char*)DeObf(dllNameObf, get_string_length(dllNameObf));
    functionName = (char*)DeObf(functionNameObf, get_string_length(functionNameObf));

    // Functional x64 MASM assembly custom GetProcAddress
    // Resolves base address of any process loaded DLL
    // PARAMS: DllName, DllName length
    size_t nameLen = strlen(dllName);
    DWORD_PTR baseAddress = GetBase(dllName, nameLen); // store retrieved address
    if (baseAddress == 0) {
        printf("Failed to get %s base address \n", dllName);
        return 1;
    }
    printf(" %s base address (Assembly DLL resolve via PEB): 0x%p \n", dllName, baseAddress);

    // Functional x64 MASM assembly custom GetModuleHandle
    // Resolves address of any process loaded DLL function
    // PARAMS: FuncName, FuncName length, DLL base address
    size_t length = strlen(functionName);
    DWORD_PTR functionAddress = resolveFunction(functionName, length, baseAddress);
    if (functionAddress == 0) {
        printf("Failed to get %s function address \n", functionName);
        return 1;
    }
    printf(" %s function address (Assembly DLL resolve via PEB): 0x%p \n", dllName, functionAddress);

    getchar(); // effectively pause EXE by getting user input
    return 0;
}
Execution:

Lets explore the IAT entries of our PE’s post compilation. Starting with the results of the Visual Studio C++ compiler.
MSVC Compiling with Visual Studio 2022 (MASM dependencies added) results in many random imports.
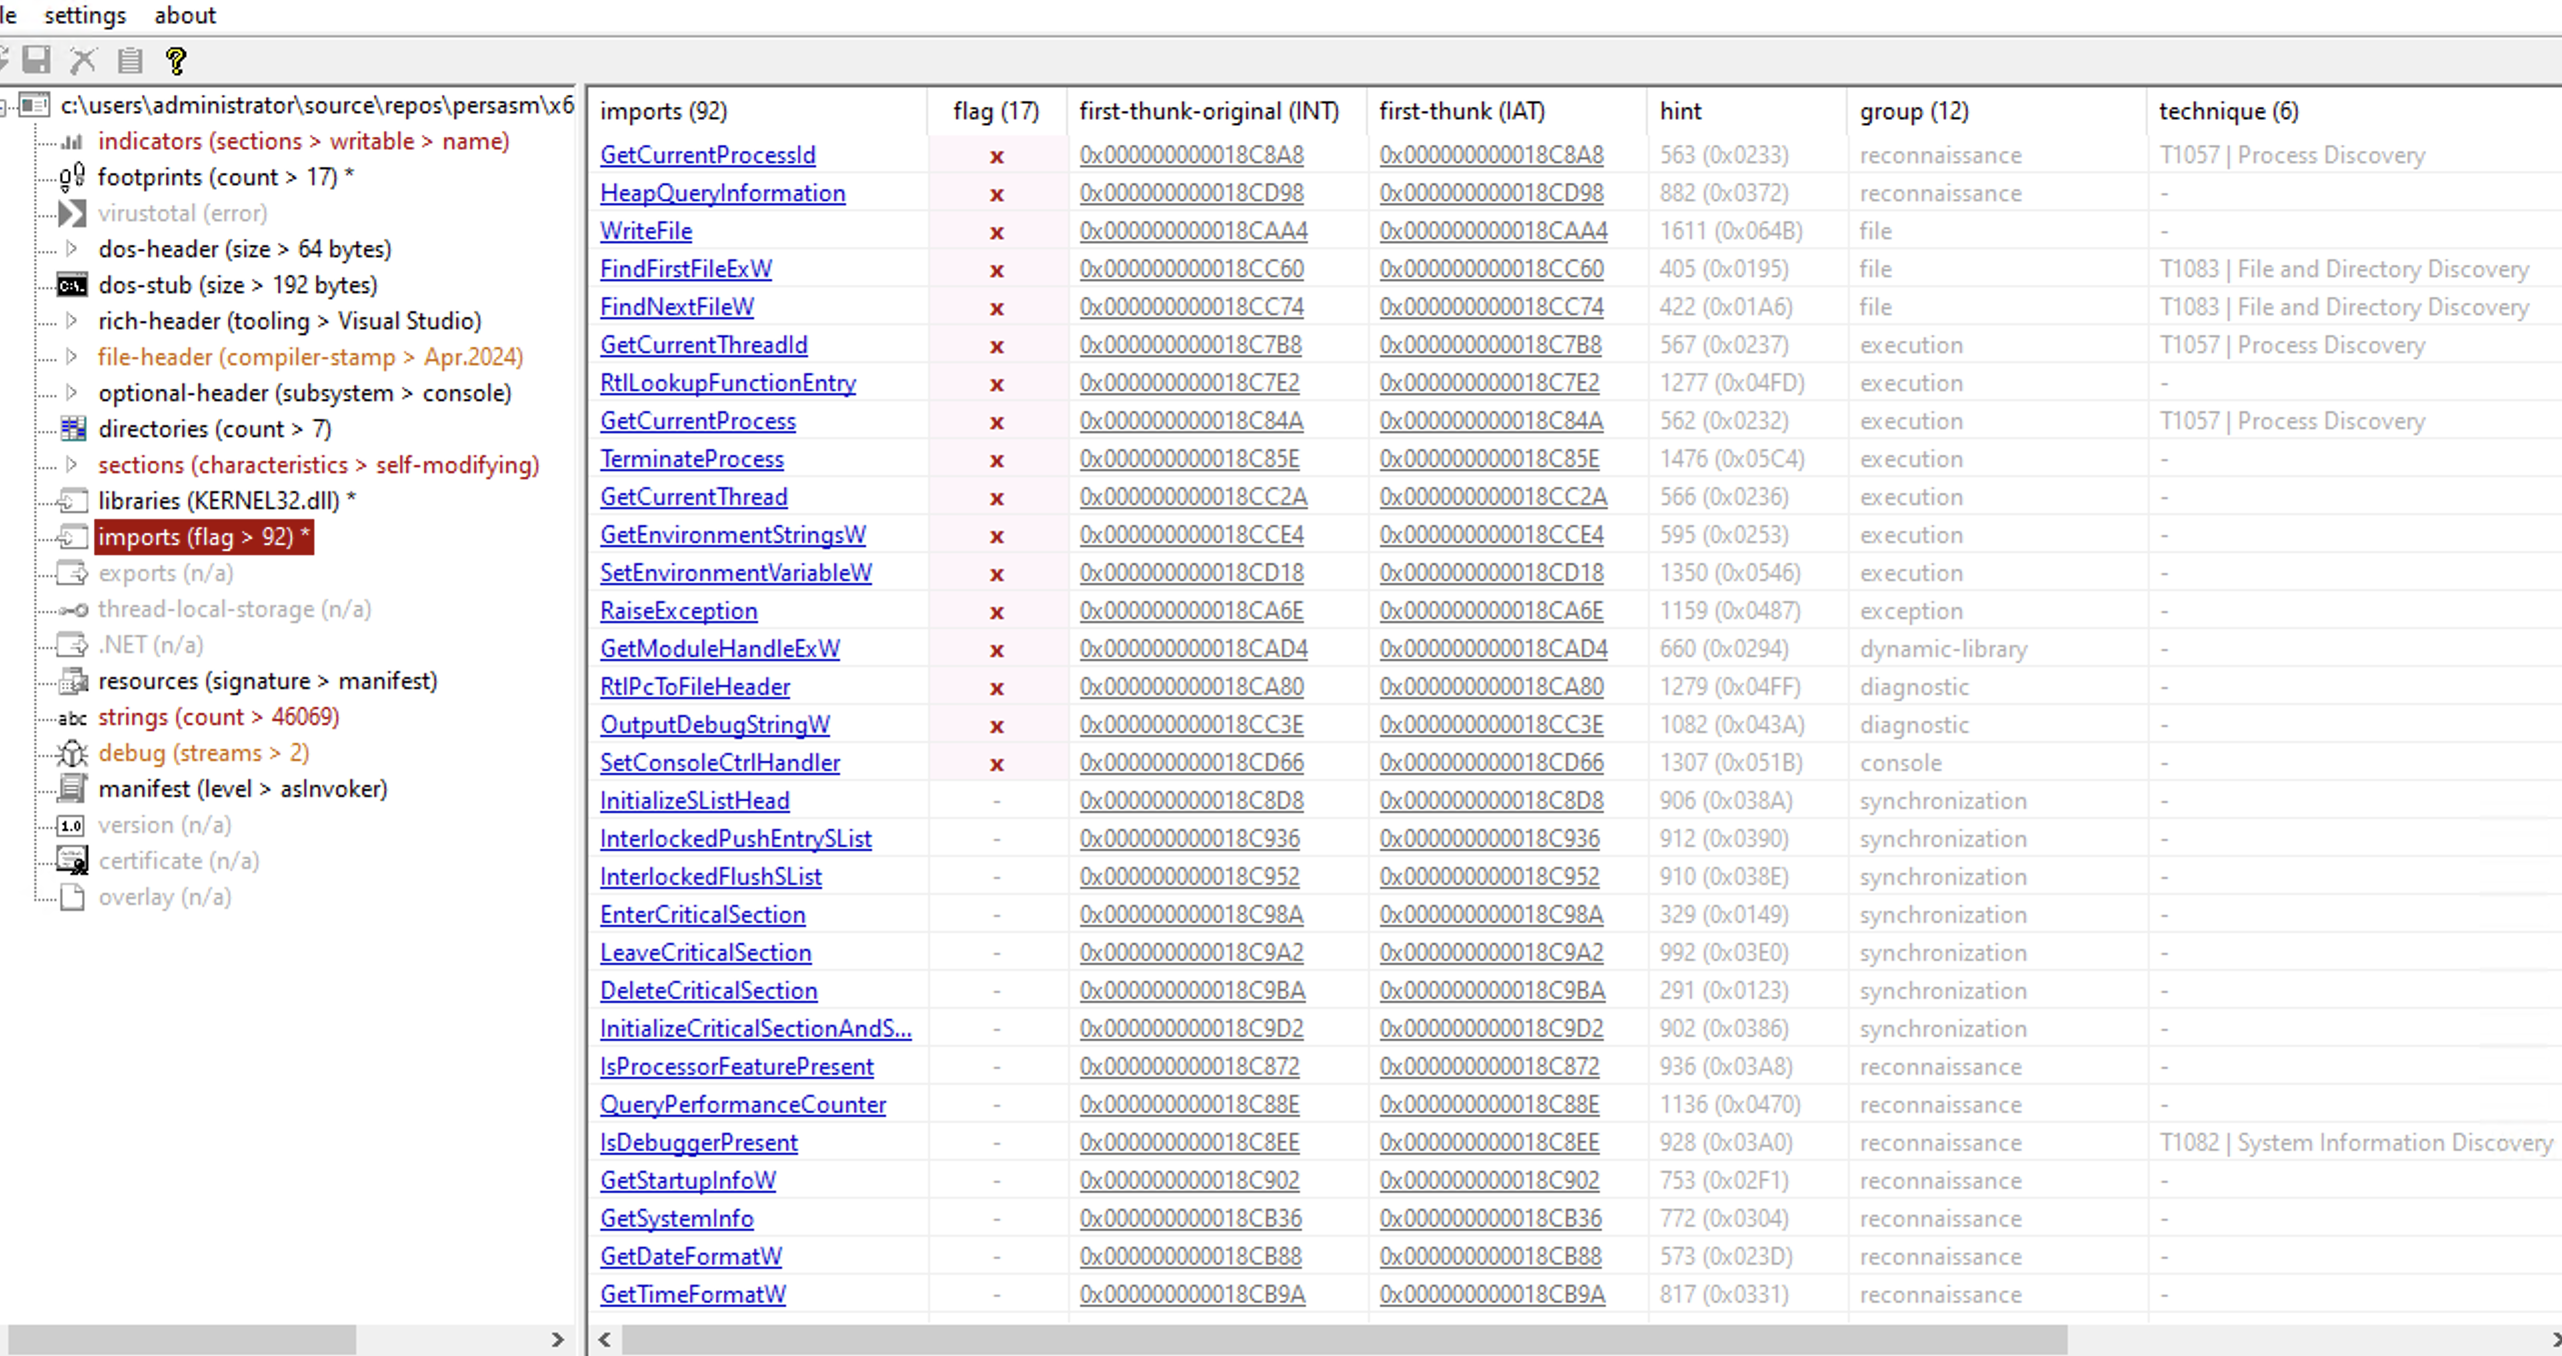
Even though we don’t directly call any KERNEL32.dll functions in our x64 MASM assembly code or in our C++ code, its likely the compiler added these entries in at compilation time. Playing around with different compilers and their options could allow us to reduce some such imports but probably not all imports as these listed function APIs are used the PE’s CRT (C runtime) library e.g ucrt or msvcrt in functions referenced by the startup or essential runtime code which is linked into every executable by default.
It is possible to compile PE’s without a CRT but we would lose access to common functionality offered by it. Perhaps it is possible to implement all required functions in x64 MASM assembly or resolve these with our custom GetBase and resolveFunc assembly functions, but this would require further exploring.
This blog shows how you might try to reduce IAT compiler or CRT imports with Visual Studio C++ compilations, but potentially at the cost of your code no longer working. It is worth playing around with settings, you might eventually achieve some good results:
In VS Project Settings - we can do things like:
C/C++ -> Code Generation /MT (Static Linking)Linker->InputC/C++ -> Code Generation /GS-C/C++>All Options>Basic Runtime Checks to DefaultLinker->Advanced e.g mainTrying these on our code would give us an error as we are not resolving printf which is defined in CRT (C Runtime)
 If we wanted we could implement our own
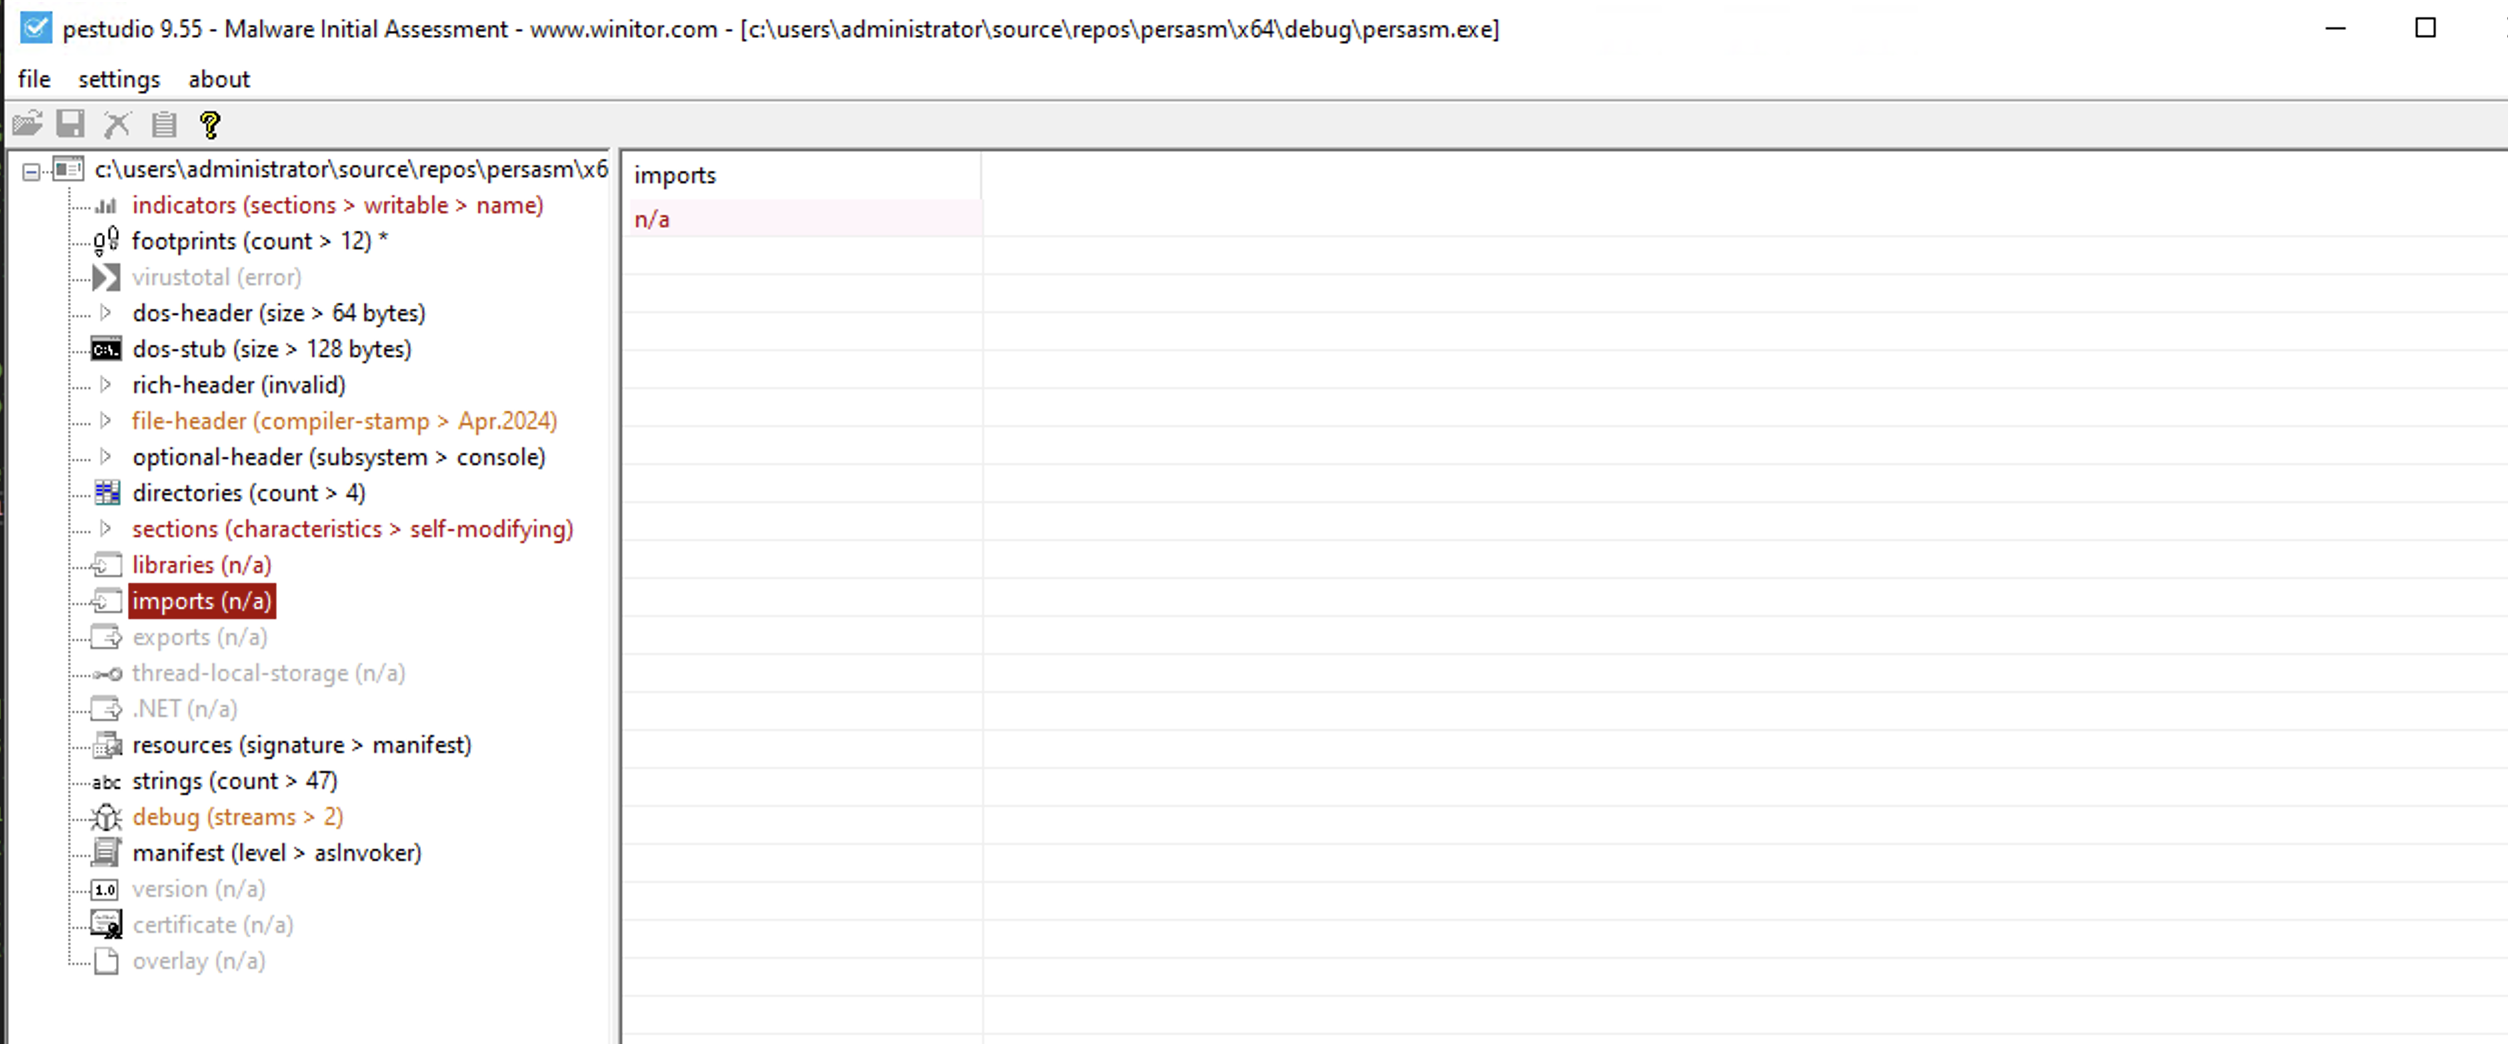
 printf function, attempt to resolve it with our custom GetBase and resolveFunction assembly functions or perhaps find some way achieving minimal linking with compiler options. However, if we perform the above modifications and removed our references of usage of printfand stdio.h from our code completely, we notice that if we debug in VS the code still works and the resulting PE has NO imports whatsoever.
Whether this is a pro or con, will need to be determined. As we need to consider that having no IAT entries could be more suspicious than having some common CRT ones. Researching this will be an exercise left to the reader.
MinGW
We can explore results offered by other compilers, let us consider the MinGW for Windows compiler. I installed it via Chocolatey with the help of this blog.
1
choco install mingw
We can assemble an object file with the x64 MASM assembly like so in x64 Native Tools for VS command prompt:
1
ml64 /c /Fo asm.obj test.asm
Then with MinGW for Windows create an object file for our C++ code, and finally link both together to produce an EXE:
1
2
g++ -m64 -c PersASM.cpp -o PersASM.o
g++ -o MinGWPersASM.exe PersASM.o asm.obj
We see the overall IAT entries number is significantly less in our PE than with Visual Studio compilations (34 less entries):
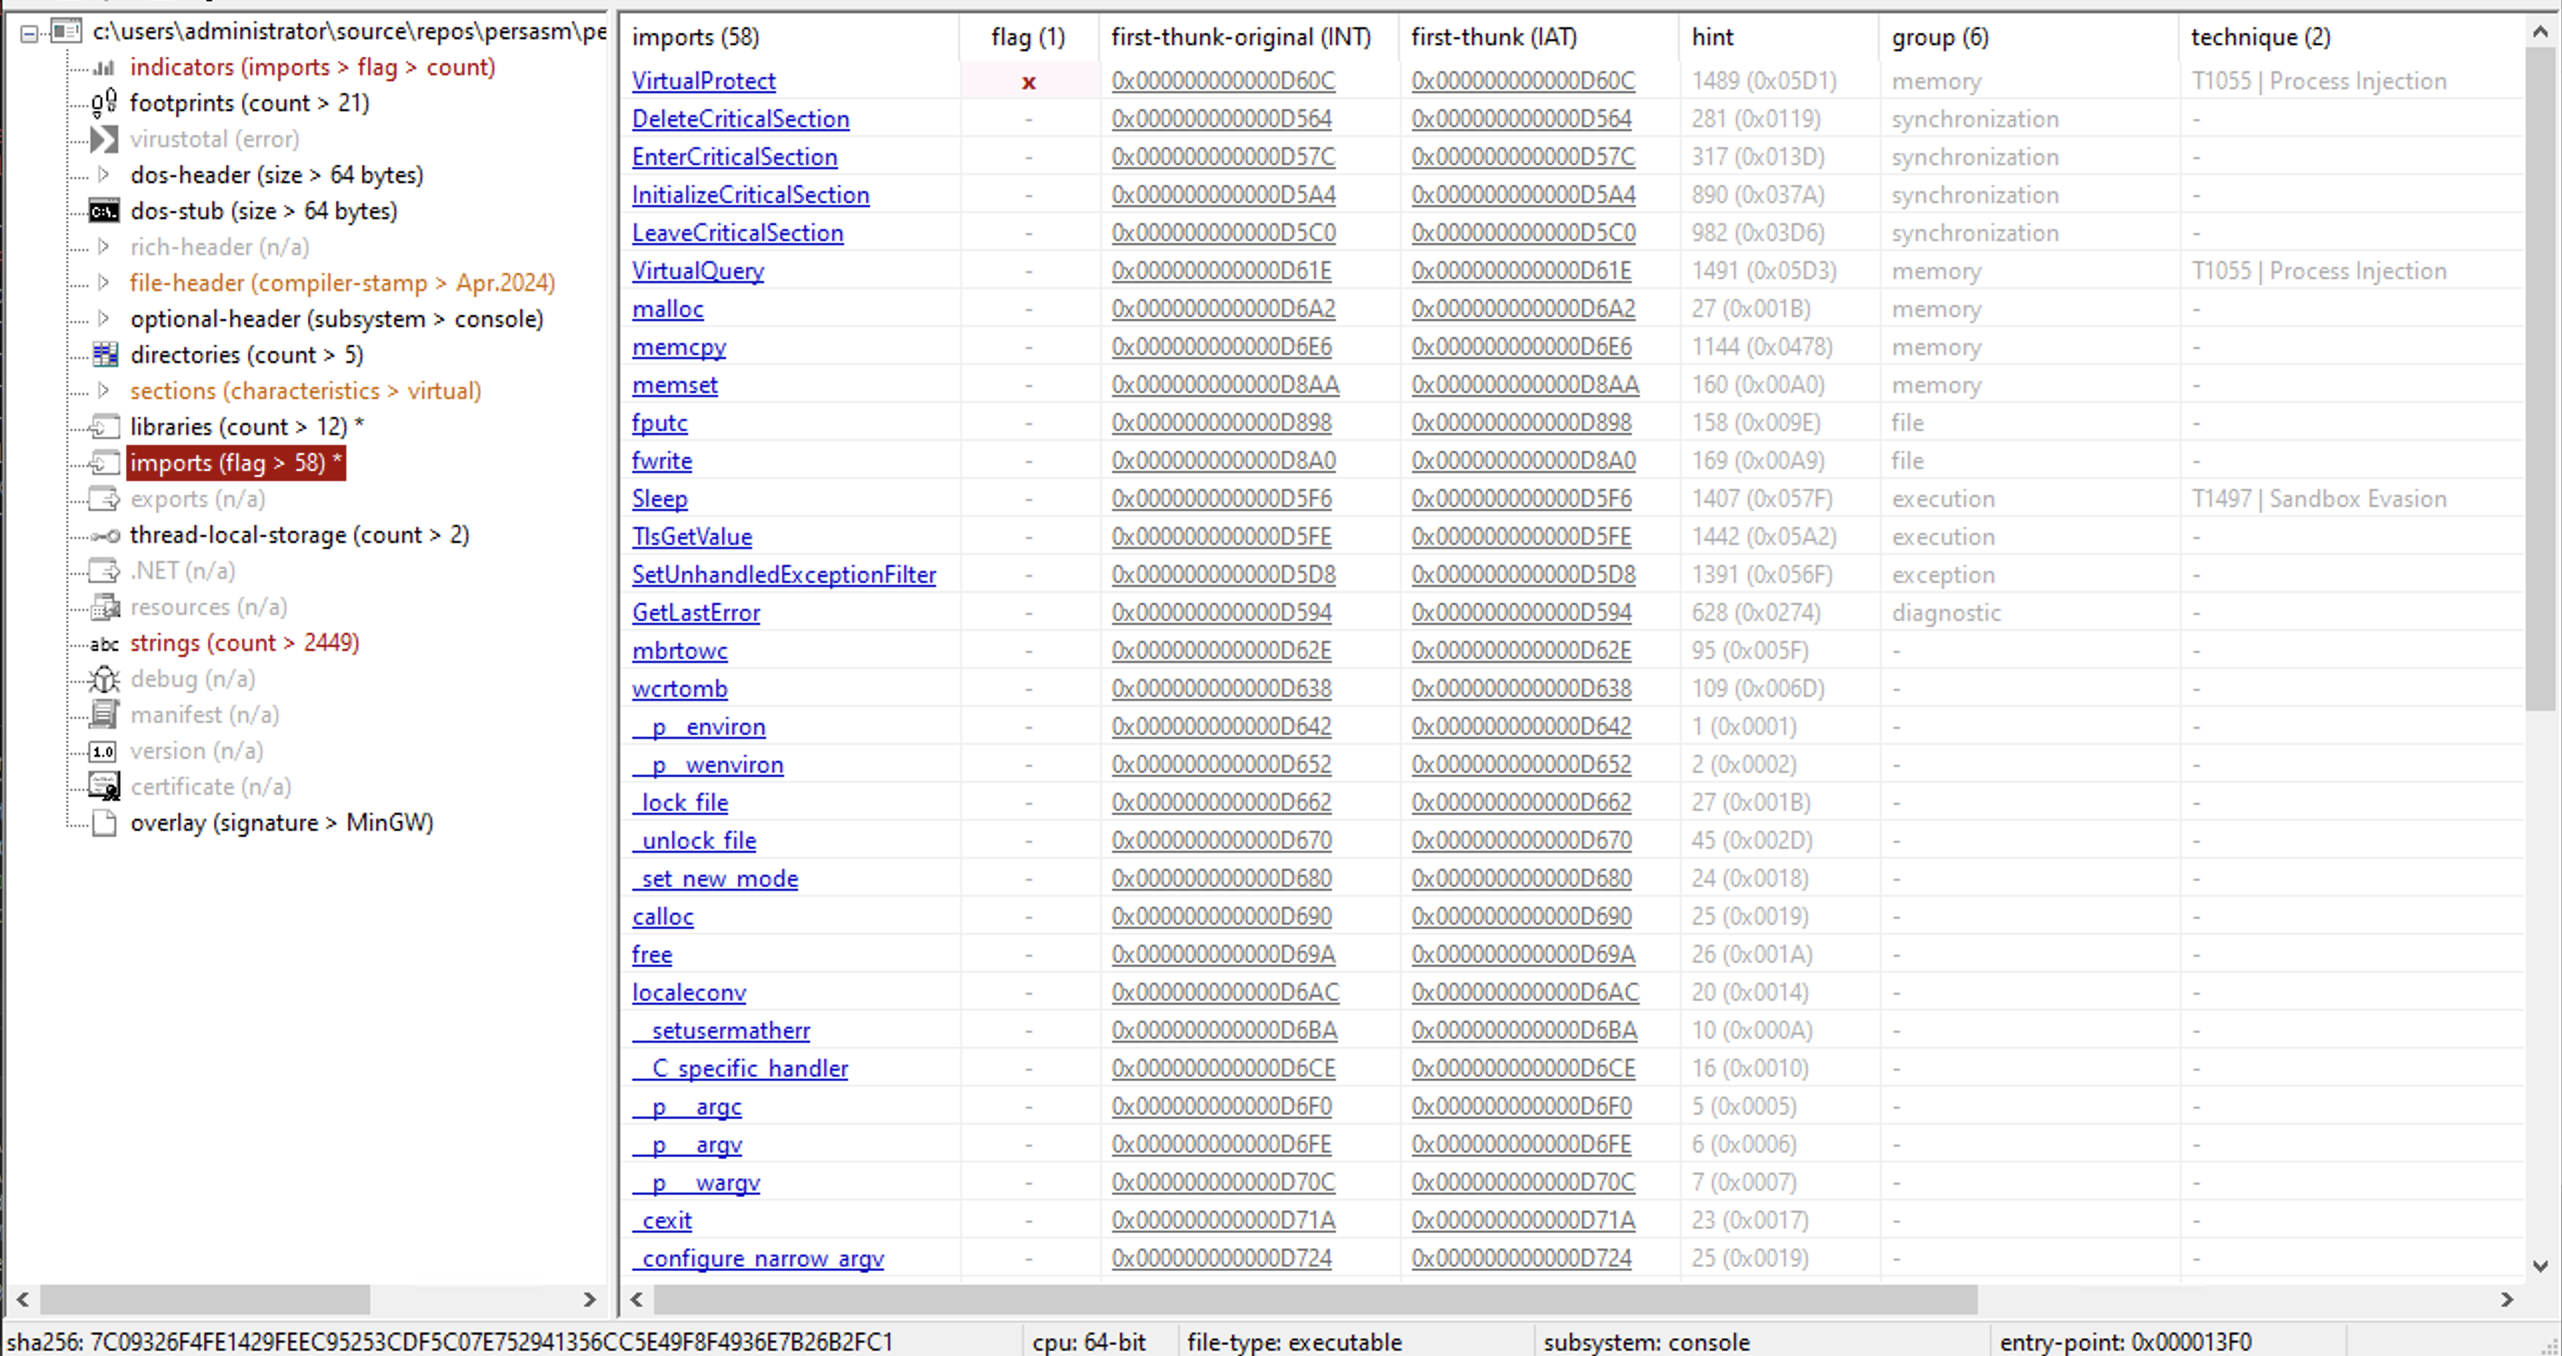
This appears already better than the default PE created by the Visual Studio 2022 compiler. But the MinGW g++ compiler or it’s CRT, imports this one semi suspicious KERNEL32.dll function - VirtualProtect.
LLVM/CLANG
Lets look at LLVM/CLANG for Windows.
1
choco install llvm
Then compiled an object file with the x64 MASM assembly like so in x64 Native Tools for VS command prompt:
1
ml64 /c /Fo asm.obj test.asm
And then also with LLVM/Clang for Windows compiled an object from the c++ code, and finally produced the EXE:
1
2
clang++ -m64 -c .\PersASM.cpp -o .\PersASM.o
clang++ -m64 .\PersASM.o .\asm.obj -o ClangPersASM.exe -v -nostdlib -lmsvcrt -nostartfiles
Clang compile:
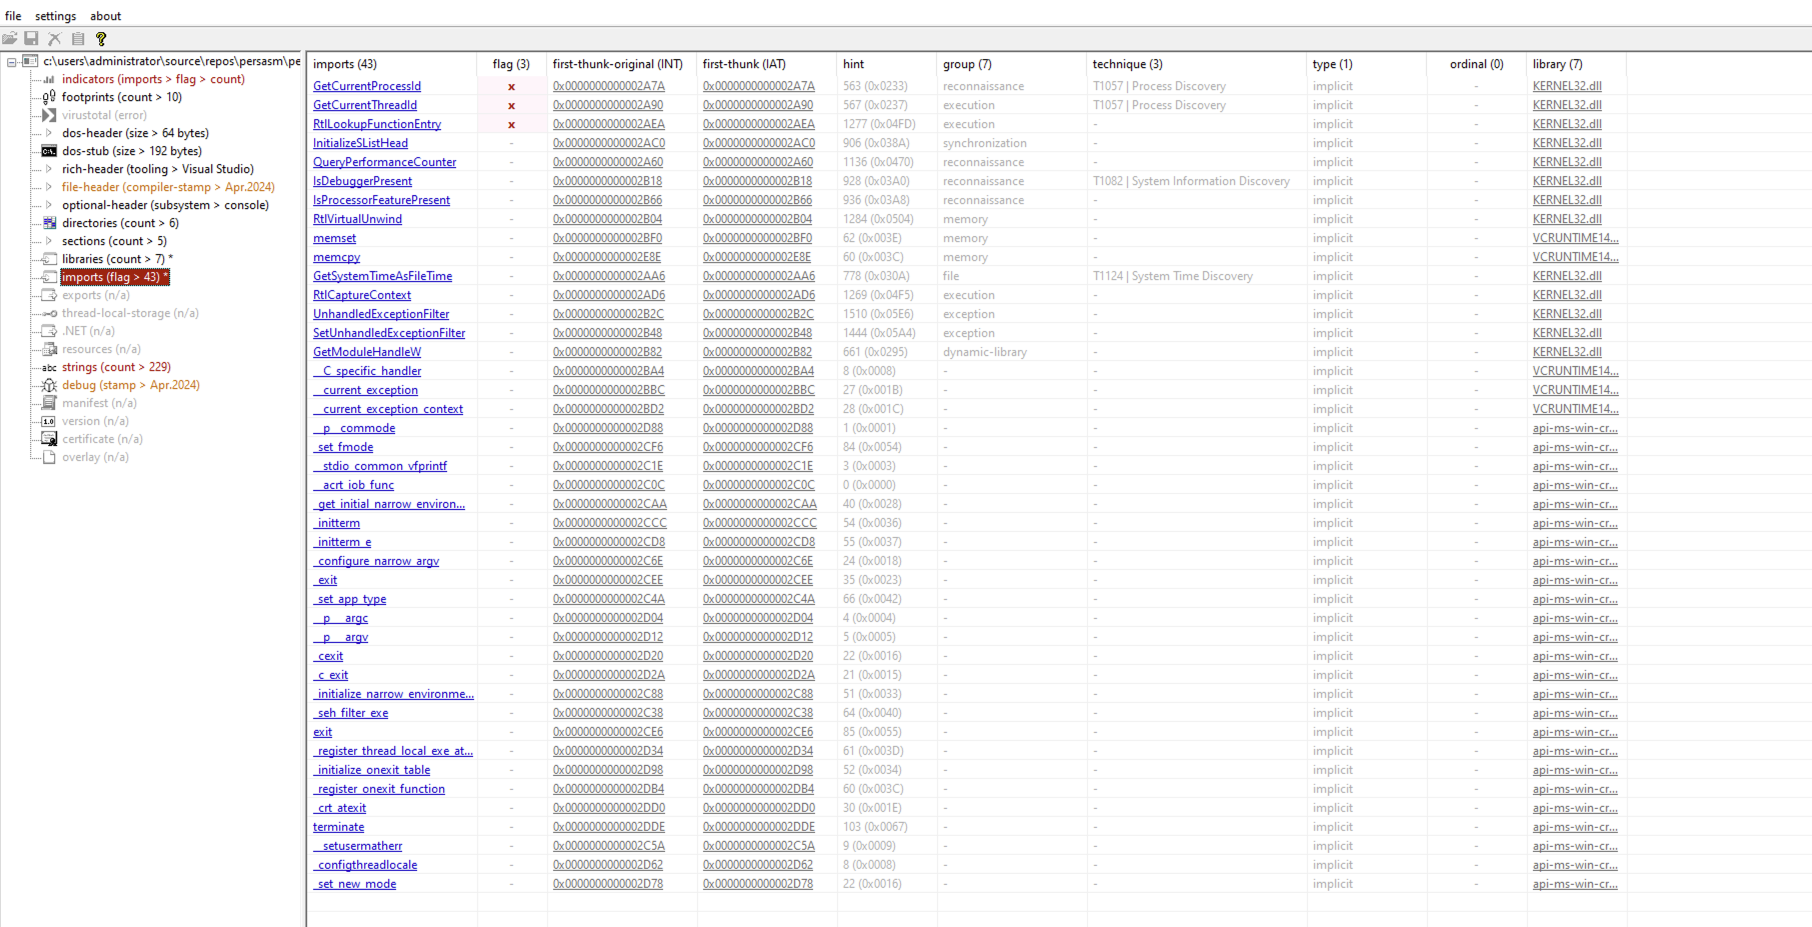
There is no VirtualProtect IAT entry as with MinGW, but we do have even less IAT entries overall with LLVM/Clang. Based on PEStudio’s output, there is also slight suspicions on our IAT entries for GetCurrentProcessId, GetCurrentThreadId and RtlLookupFunctionEntry.
We have explored the PE files outputted by various compilation techniques, and have seen how different compilers impact our IAT entries and we even briefly explored how we could achieve NO IAT entries at all. Ultimately, apart from from the compiler additions to the IAT table we still have the ability to mask suspicious function usage with our custom GetBase and resolveFunc assembly functions.
So let’s recap what was covered in the Flying Under the Radar series - Part 1:
PEBHopefully you enjoyed the blog or have gained some ideas of you own as to how you can improve your malware development process, and defeat Static & Dynamic Analysis. Don’t hesitate to reach out to me if you have any feedback.
Next, lets discuss Indirect Syscalls and their benefits. And discuss the opportunity to potentially make them better.